Logstash x Spring Boot Integration
To read and process spring boot generated logstash using GROK pattern recognition


To make things simpler for this tutorial, we will have a simple hello-world application that will generate random logs.
Let's start logstash to ensure it works first, here is a first configuration:
input {
    file {
        type => "log"
        path => ["/Users/Smit/Downloads/demo/myapp.log" ]
    }
}

output {
    stdout {}
}
This will read the logs and the output will look similiar to below:
{
    "@timestamp" => 2022-12-17T10:56:05.578Z,
          "host" => "Smits-MacBook-Pro.local",
          "path" => "/Users/Smit/Downloads/demo/myapp.log",
      "@version" => "1",
          "type" => "log",
       "message" => "2022-12-17T18:56:04.829+08:00  INFO 20365 --- [http-nio-8080-exec-5] com.example.demo.GreetingController      : Some random log 22f9dc1c-52f7-4c6f-ae29-80c7ecfa9627"
}
However in this, the message from the log is not being processed to give us info, rather it is up to the reader to identify the log. Let's process the message and add a few more attributes.
To build a GROK, a few articles will help to understand the different in-built functionality.
https://www.elastic.co/guide/en/logstash/current/plugins-filters-grok.html
https://logz.io/blog/logstash-grok/
Lets understand the log generated by Spring Boot First:
2022-12-17T18:56:04.829+08:00 INFO 20365 --- [http-nio-8080-exec-5] com.example.demo.GreetingController : Some random log 22f9dc1c-52f7-4c6f-ae29-80c7ecfa9627
2022-12-17T18:56:04.829+08:00 Is a timestamp at which the log was generated
INFO is a log level, where we know which log to take action against.
20365 is a simple process id
--- it is a log seperator
[http-nio-8080-exec-5] This is a tomcat process info
com.example.demo.GreetingController The file that generated the log
: Colon to separate the file and actual log line.
Some random log 22f9dc1c-52f7-4c6f-ae29-80c7ecfa9627 The rest is a random text manually transcribed by the developer.
Now taking the info lets build the pattern first:
%{TIMESTAMP_ISO8601:log-timestamp}%{SPACE}%{WORD:log-level} %{NUMBER:log-process-id} --- \[%{DATA:log-tomcat-metadata}\] %{DATA:log-class-name} %{SPACE} : %{GREEDYDATA:log-message}
Before explaining the format, let's understand the format:
It will start with %{ and the key on the left of : are a PATTERN (inbuild) and the right of : is the variable it will assign to. and ends with }
For Example: %{WORD:log-level}
It will extract a WORD (from this time point to the next space available) and assign it to variable name log-level . If the variable is not available, it will create one.
Now let's go into detail about the above GROK pattern:
%{TIMESTAMP_ISO8601:log-timestamp} This is an inbuilt pattern to extract ISO standard timestamp
%{SPACE} This will remove any extra space between the timestamp and the next word.
%{WORD:log-level} This will extract the log level.
{NUMBER:log-process-id} This will extract any number available until the next space in the log line.
\[%{DATA:log-tomcat-metadata}\] This will take anything into the brackets and save it to a variable.
and this analysis continues.
Now let's take a sample log line generated by the Spring-Boot application and see what the out of the Logstash looks like:
2022-12-17T19:29:12.524+08:00 INFO 23676 --- [nio-8080-exec-8] com.example.demo.GreetingController : Some random log 66f8e6d8-52dc-4340-9e0c-2466a468b8cf
{
                   "path" => "/Users/Smit/Downloads/demo/myapp.log",
    "log-tomcat-metadata" => "http-nio-8080-exec-8",
         "log-process-id" => "23676",
                   "host" => "Smits-MacBook-Pro.local",
         "log-class-name" => "com.example.demo.GreetingController",
               "@version" => "1",
              "log-level" => "INFO",
                   "type" => "log",
                "message" => "2022-12-17T19:29:12.524+08:00  INFO 23676 --- [http-nio-8080-exec-8] com.example.demo.GreetingController      : Some random log 66f8e6d8-52dc-4340-9e0c-2466a468b8cf",
          "log-timestamp" => "2022-12-17T19:29:12.524+08:00",
            "log-message" => "Some random log 66f8e6d8-52dc-4340-9e0c-2466a468b8cf",
             "@timestamp" => 2022-12-17T11:29:13.370Z
}
Now as we can see how, we have extracted the data into the variables correctly, now with the info available, we can either put to Elasticsearch or give it to the user to analyse. Or even at Logstash, you can do more with this extracted data. Like if the LogLevel is WARN, send to a particular index or publish a Kafka message etc.
Lets stitch things together, and here is the Logstash Configuration:
input {
    file {
        type => "log"
        path => ["/Users/Smit/Downloads/demo/myapp.log" ]
    }
}

filter {

    grok {
        match => { "message" => "%{TIMESTAMP_ISO8601:log-timestamp}%{SPACE}%{LOGLEVEL:log-level} %{NUMBER:log-process-id} --- \[%{DATA:log-tomcat-metadata}\] %{DATA:log-class-name} %{SPACE} : %{GREEDYDATA:log-message}" }
    }

}

output {
    stdout {}
}
And this is what the output looks like:
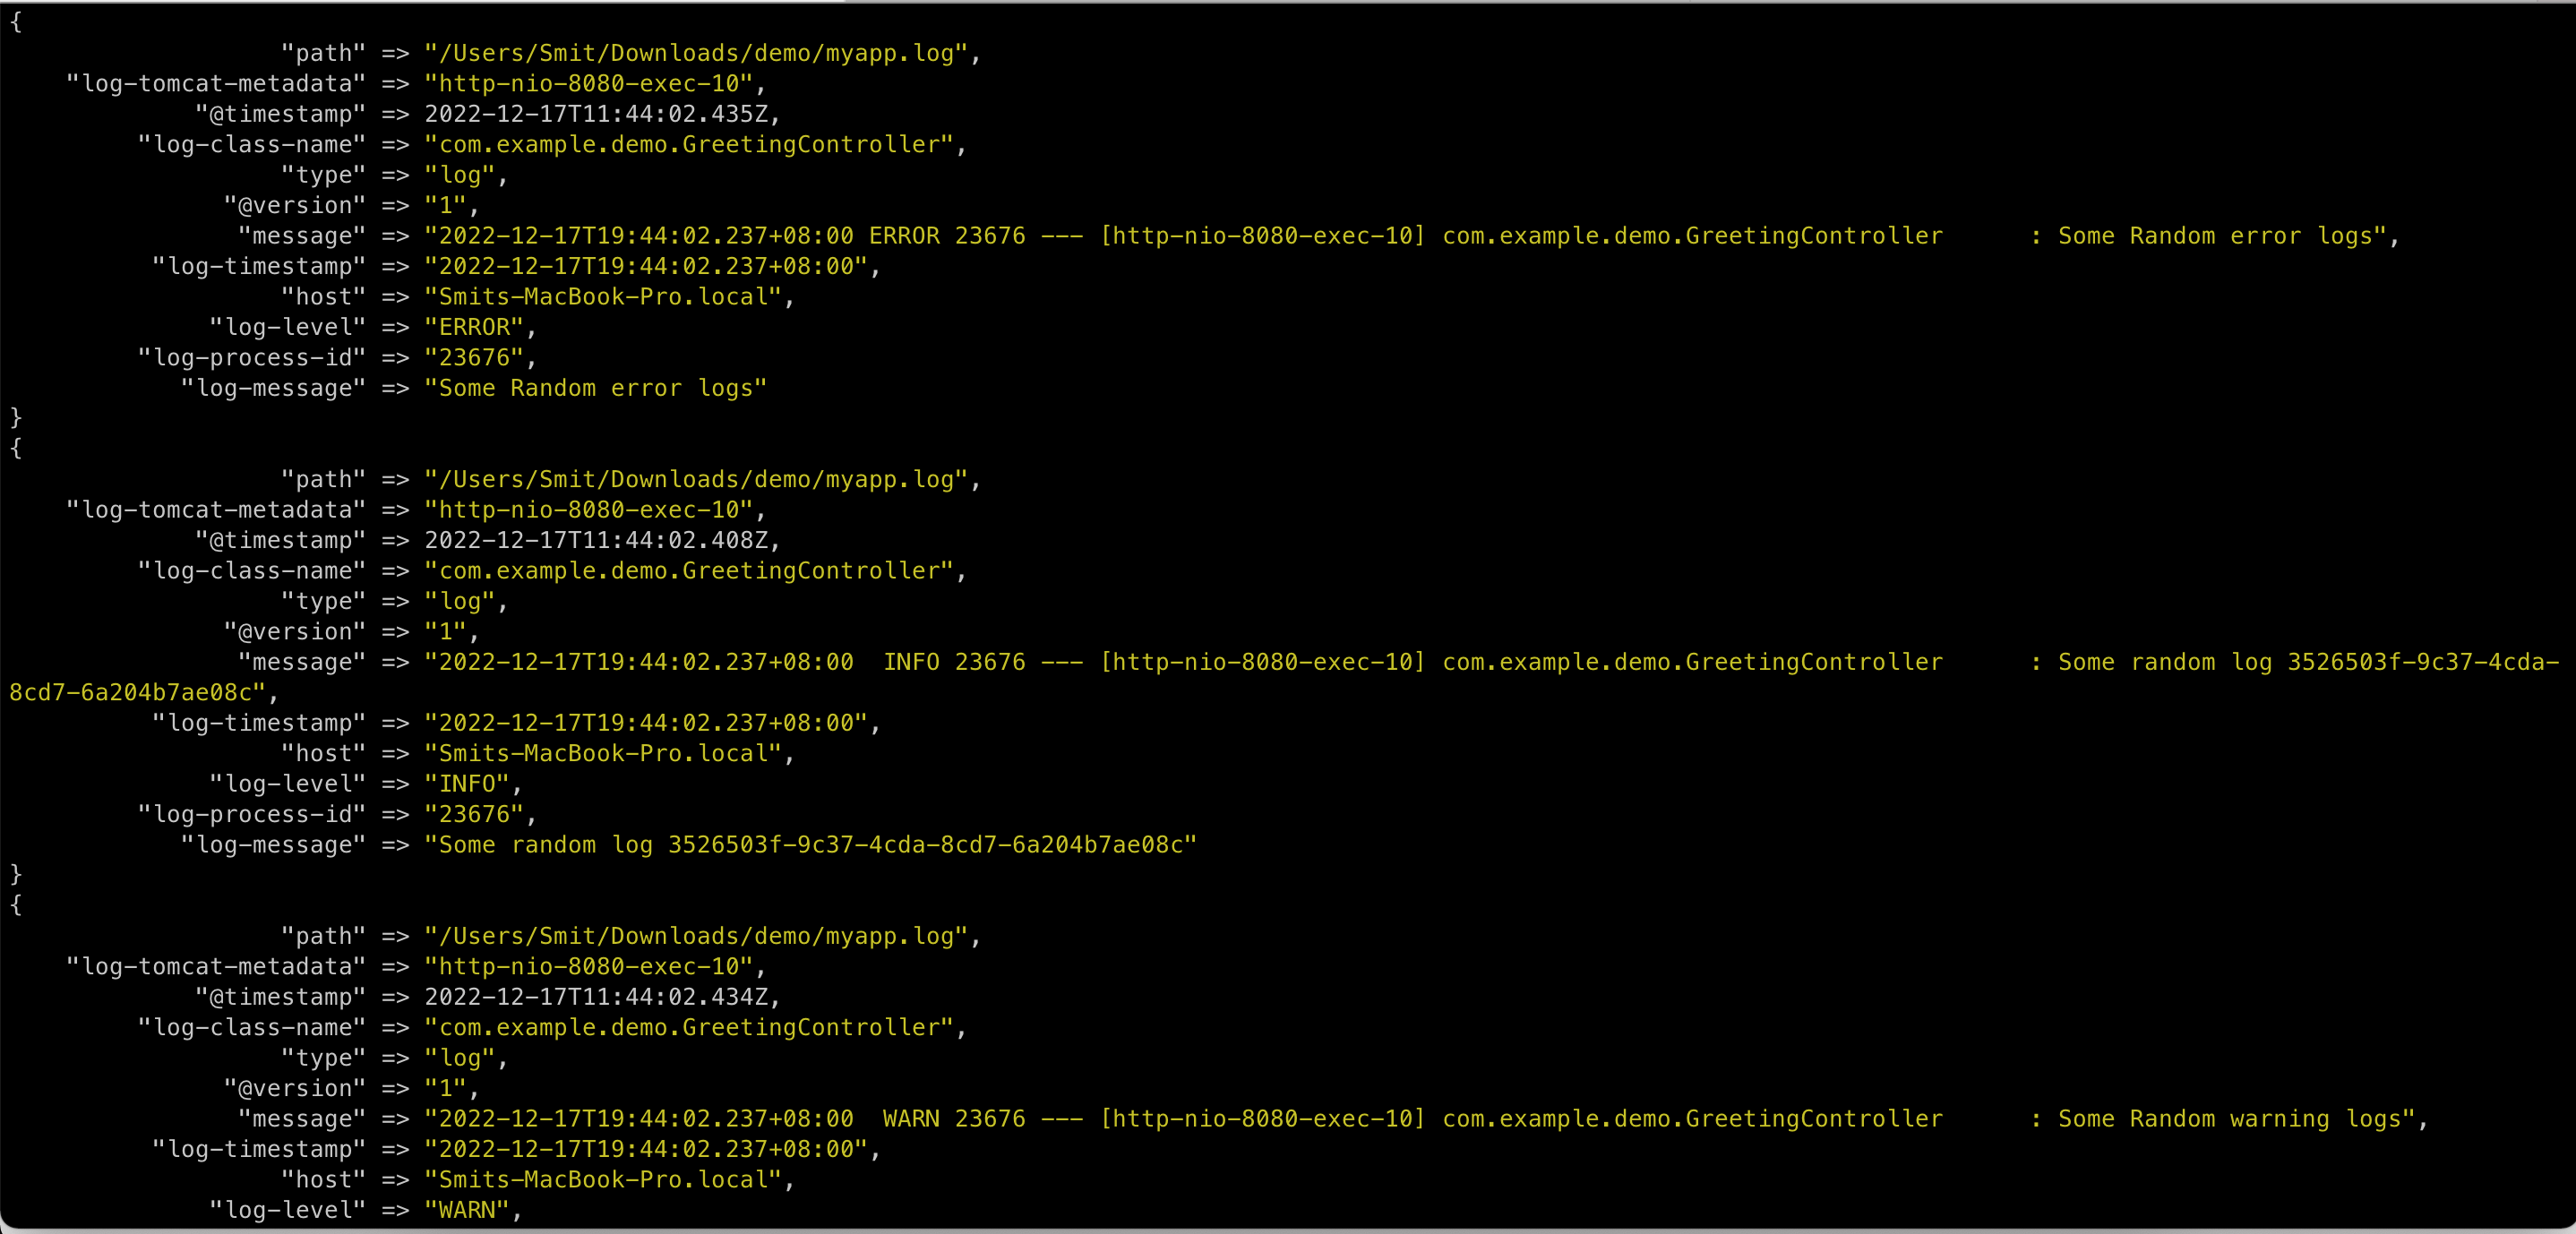
This concludes the tutorial on using Grok Patterns for Spring Boot-generated logs.
Feel free to share your thoughts and feedbacks on comments or on twitter at @smit_shah_95